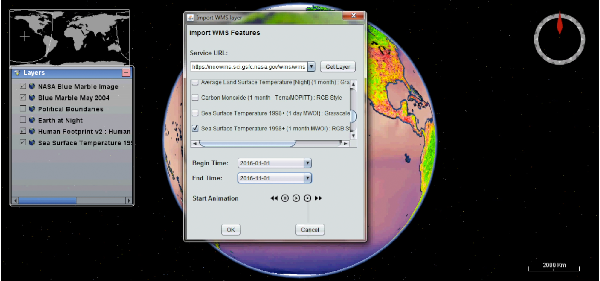
Visualize Web Service
WMS & WFS Features Visualization
A web service layer may be loaded for visualization, with optional time parameters available as filters. The tool will auto adjust itself and zoom in to focus on the area of interest. If time attributes are specified, the output animation will only display data for the time range selected.
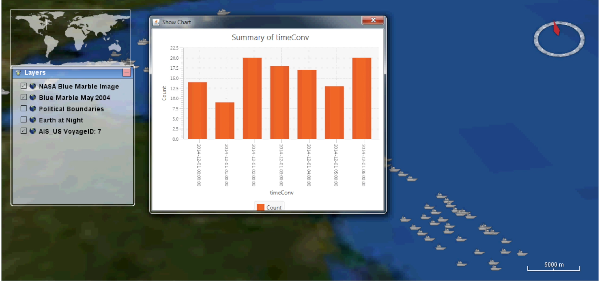
Visualize Analytical Results
Vertical Profiling and Time-Series
The vertical profiling option allows users to generate a vertical profile graph from the selected attributes. This helps the user engage in visual analytics with the summarized data. The time series option allows users to track the movements of ships based on time attributes.