mobirise.com

VisAIS: An Integrated 4D Marine Traffic Data Visualization Tool


Designed by team OGC Testbed 13 from the University of Denver Department of Geography and the Environment
Xuantong Wang - Marta Blanco Castano,  Mentor: Dr. Jing Li

In this application, we aim to integrate multiple types of information provided in different standards while maintaining web security standards. This is done by offering interactive visualization and analysis of Automatic Identification System (AIS) data (ship tracks, routes) and ancillary datasets via OGC web services (i.e., WMS, WFS, WCS). The developed application exhibits three main features. First, it supports marine and immigration data provided as geospatial web services (e.g., WFS), to facilitate data interoperability. When Integrated with World Wind, it can further provide multiple visualization methods to represent marine traffic information (e.g., ship tracking, density mapping) as well as demographic aspects around urban ports (e.g., Helsinki). It thus focuses on analyzing shipping-related information and marine transportation, by coupling environmental and social economic datasets. The tool hopes to assist with decision-making, particularly in cities experiencing changes in sustainability, immigration, and mass-movement of goods, people, and resources. (Read More)

Functions

Web Service

Display web service options for WFS, WCS, or WMS

In this client, users can display web service loading options for selection (WFS, WCS, or WMS) . Via the import web service features box, users may specify the service URL and additional customization functions for handling and displaying data.
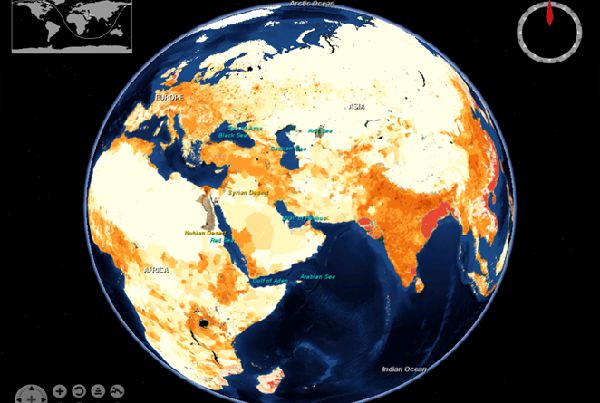
Visualization

Visualize outputs efficiently

The desktop client enables visual and analytical tasks, as related to mass migration data support needs. It is capable of handling complex analyses and rendering of large datasets (e.g., big data). The client includes three major modules: data management, visualization module, and analytical module. 
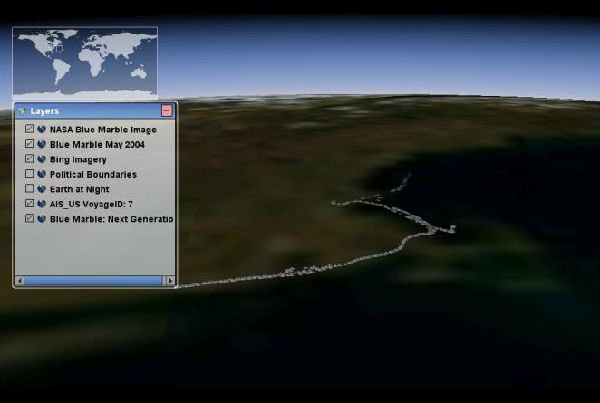
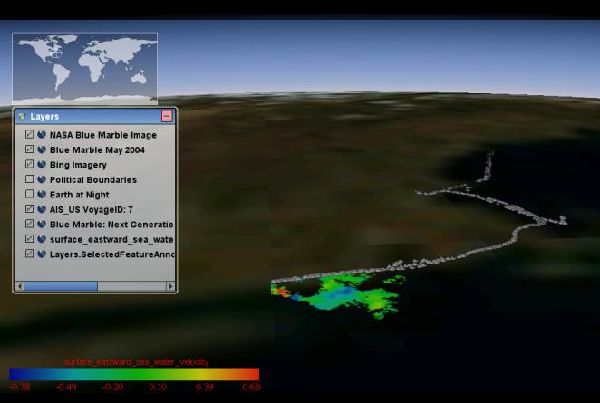
Analysis

Further analysis performed on the loaded layers

The interface component enables user manipulation of datasets, classification and analysis functions, and information and visualization outputs. Further analysis can be performed on the loaded layer/s (classification, density mapping, time-based tracking, and data profiling).

Introduction Video

This 3 minutes video will demonstrate the key functions and tools of our application including:
1. Main functions for WMS, WFS, and WCS
2. General Interface Functions (e.g., layer control, time-based animation, loading web service layers)
3. Analysis Functions (classification, density mapping, feature tracking, and vertical profiling)

CONTACT FORM

Contact us if you have any questions

SHARE THIS PAGE